


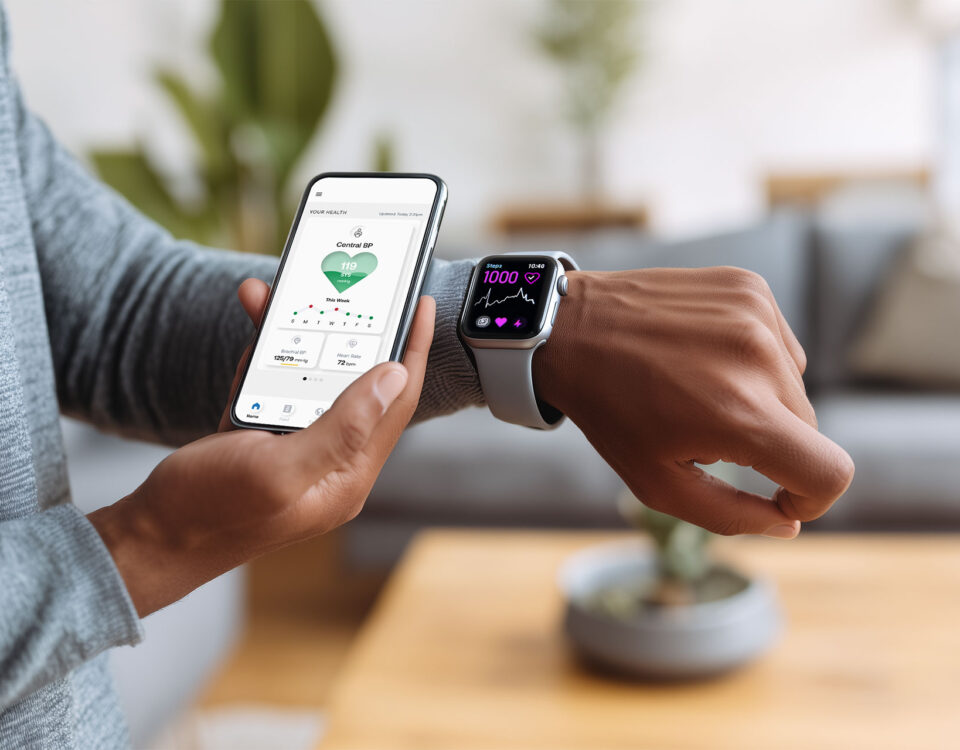
Welcome to your journey toward Arterial Intelligence™. Your personalized reports, Baseline, On-Demand, and Cardiology, provide deeper cardiovascular health insights that help you track trends, assess risk, and take meaningful steps toward long-term well-being.
Unlike a single blood pressure reading, which only captures a moment in time, these reports reveal how your cardiovascular health is evolving. Each new Cardiology Report builds on the last, allowing you to monitor progress, recognize patterns, and make informed decisions about your health.

Medical Grade, Accurate, FDA-Cleared Heart Insights.
Save 20% on checkout with code VITALITY
Understanding Your Reports
Understanding Your Reports
Baseline Report
Your Baseline Report provides your first snapshot of arterial health and is always included with your device. When you pair your Pulse for the first time, you’ll complete a short Baseline Assessment that creates this report. It establishes your starting point so you can see how future readings compare over time.
On-Demand Reports
On-Demand Reports function the same way as your Baseline Report but can be generated anytime with Care+ or a 10-pack of On-Demand Assessments. They are helpful for checking in after a change in routine, adjusting medication, or preparing for a doctor’s visit.
Monthly Cardiology Reports
With Care+, you’ll also receive a detailed 12-page Cardiology Report every 30 days. These reports bring together your data from the past month to show trends and patterns over time, including seven key vascular biomarkers.
Tracking Trends: Why Multiple Reports Matter
A single report provides useful information, but combining snapshots and long-term tracking gives a clearer picture of your vascular health.
- On-Demand Reports help you see how your numbers look in the moment and are best for quick check-ins.
- Cardiology Reports compile data over 30 days, revealing trends and long-term changes that single readings cannot capture.
Together, these reports allow you to:
- Detect early signs of arterial changes
- Measure the impact of lifestyle changes or treatments
- Identify meaningful patterns beyond one-off readings
Each dot on a Cardiology Report trend graph represents a daily average, smoothing out short-term fluctuations and highlighting long-term progress. This helps you see whether your numbers are stable, improving, or trending in a direction that requires attention. , track trends, and take meaningful steps toward optimizing your cardiovascular health.
What Your Reports Measure and Why It Matters
Baseline and On-Demand Reports give you concise snapshots based on two valid readings in one session. Cardiology Reports expand on this by compiling at least 30 days of data into detailed insights and long-term patterns.
The Cardiology Report also tracks seven key vascular biomarkers that assess circulatory efficiency, arterial stiffness, and heart strain. Most parameters are evaluated against reference ranges, categorizing results as within, below, or above the expected range.
Key Biomarkers in Your Reports
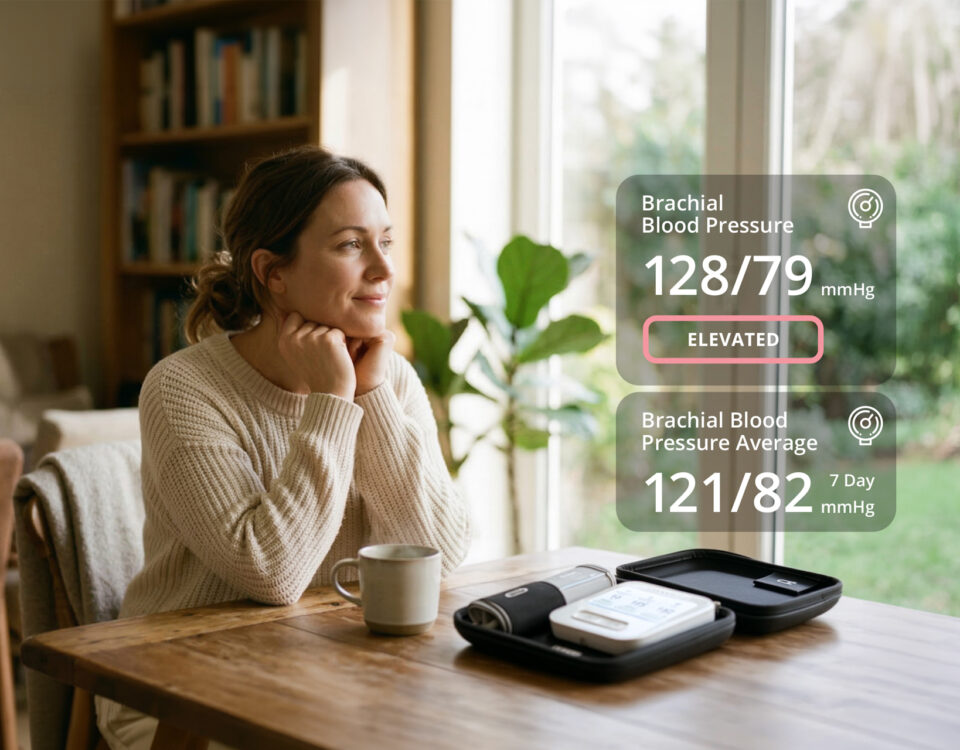
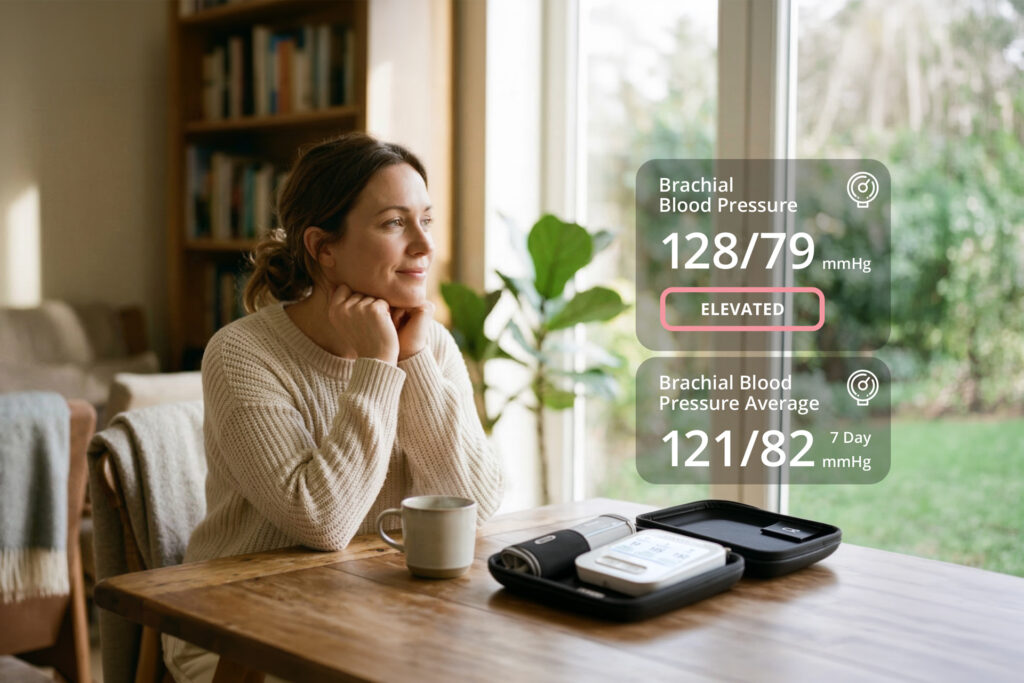
Brachial blood pressure is the traditional arm-based blood pressure measurement and provides useful information about overall cardiovascular health. While important, it does not assess central pressure or arterial stiffness, which offer deeper insights into heart and vascular function.
Central blood pressure (CBP) and central pulse pressure (CPP) measure the pressure inside the aorta, the large artery that carries blood from your heart to the rest of your body. Unlike brachial blood pressure, CBP reflects the pressure your heart and organs actually experience. It is considered a more direct indicator of cardiovascular risk. Higher values may signal increased strain on the heart and a greater risk of hypertension or heart disease. CPP, the difference between central systolic and diastolic pressure, helps assess arterial stiffness and how much work the heart has to do.
Augmentation pressure (AP) and augmentation index (AIx) assess arterial stiffness, which affects how efficiently blood flows through your arteries. When arteries lose flexibility due to aging, high blood pressure, or plaque buildup, the heart must work harder to pump blood, increasing the risk of hypertension, heart attacks, and stroke.
Pulse pressure amplification (PPA) measures how pressure changes as blood moves from central to peripheral arteries. A lower PPA may indicate early signs of vascular aging, meaning circulation isn’t functioning as efficiently as it should. When arterial stiffness develops earlier than expected, it can increase cardiovascular strain. This raises the risk of heart disease sooner than anticipated for your age.
Subendocardial viability ratio (SEVR) measures whether your heart muscle is receiving enough oxygen. A low SEVR suggests that the heart isn’t receiving the oxygen it needs, which can put strain on the cardiovascular system. It is also an indirect marker of reduced blood flow and stiffening of the arteries, including those that supply the heart. Over time, this may lead to decreased heart efficiency and increased cardiovascular risk.
By tracking all seven key biomarkers, your Cardiology Report helps you take meaningful steps toward optimizing your cardiovascular health.
How Your Reports Assess Risk
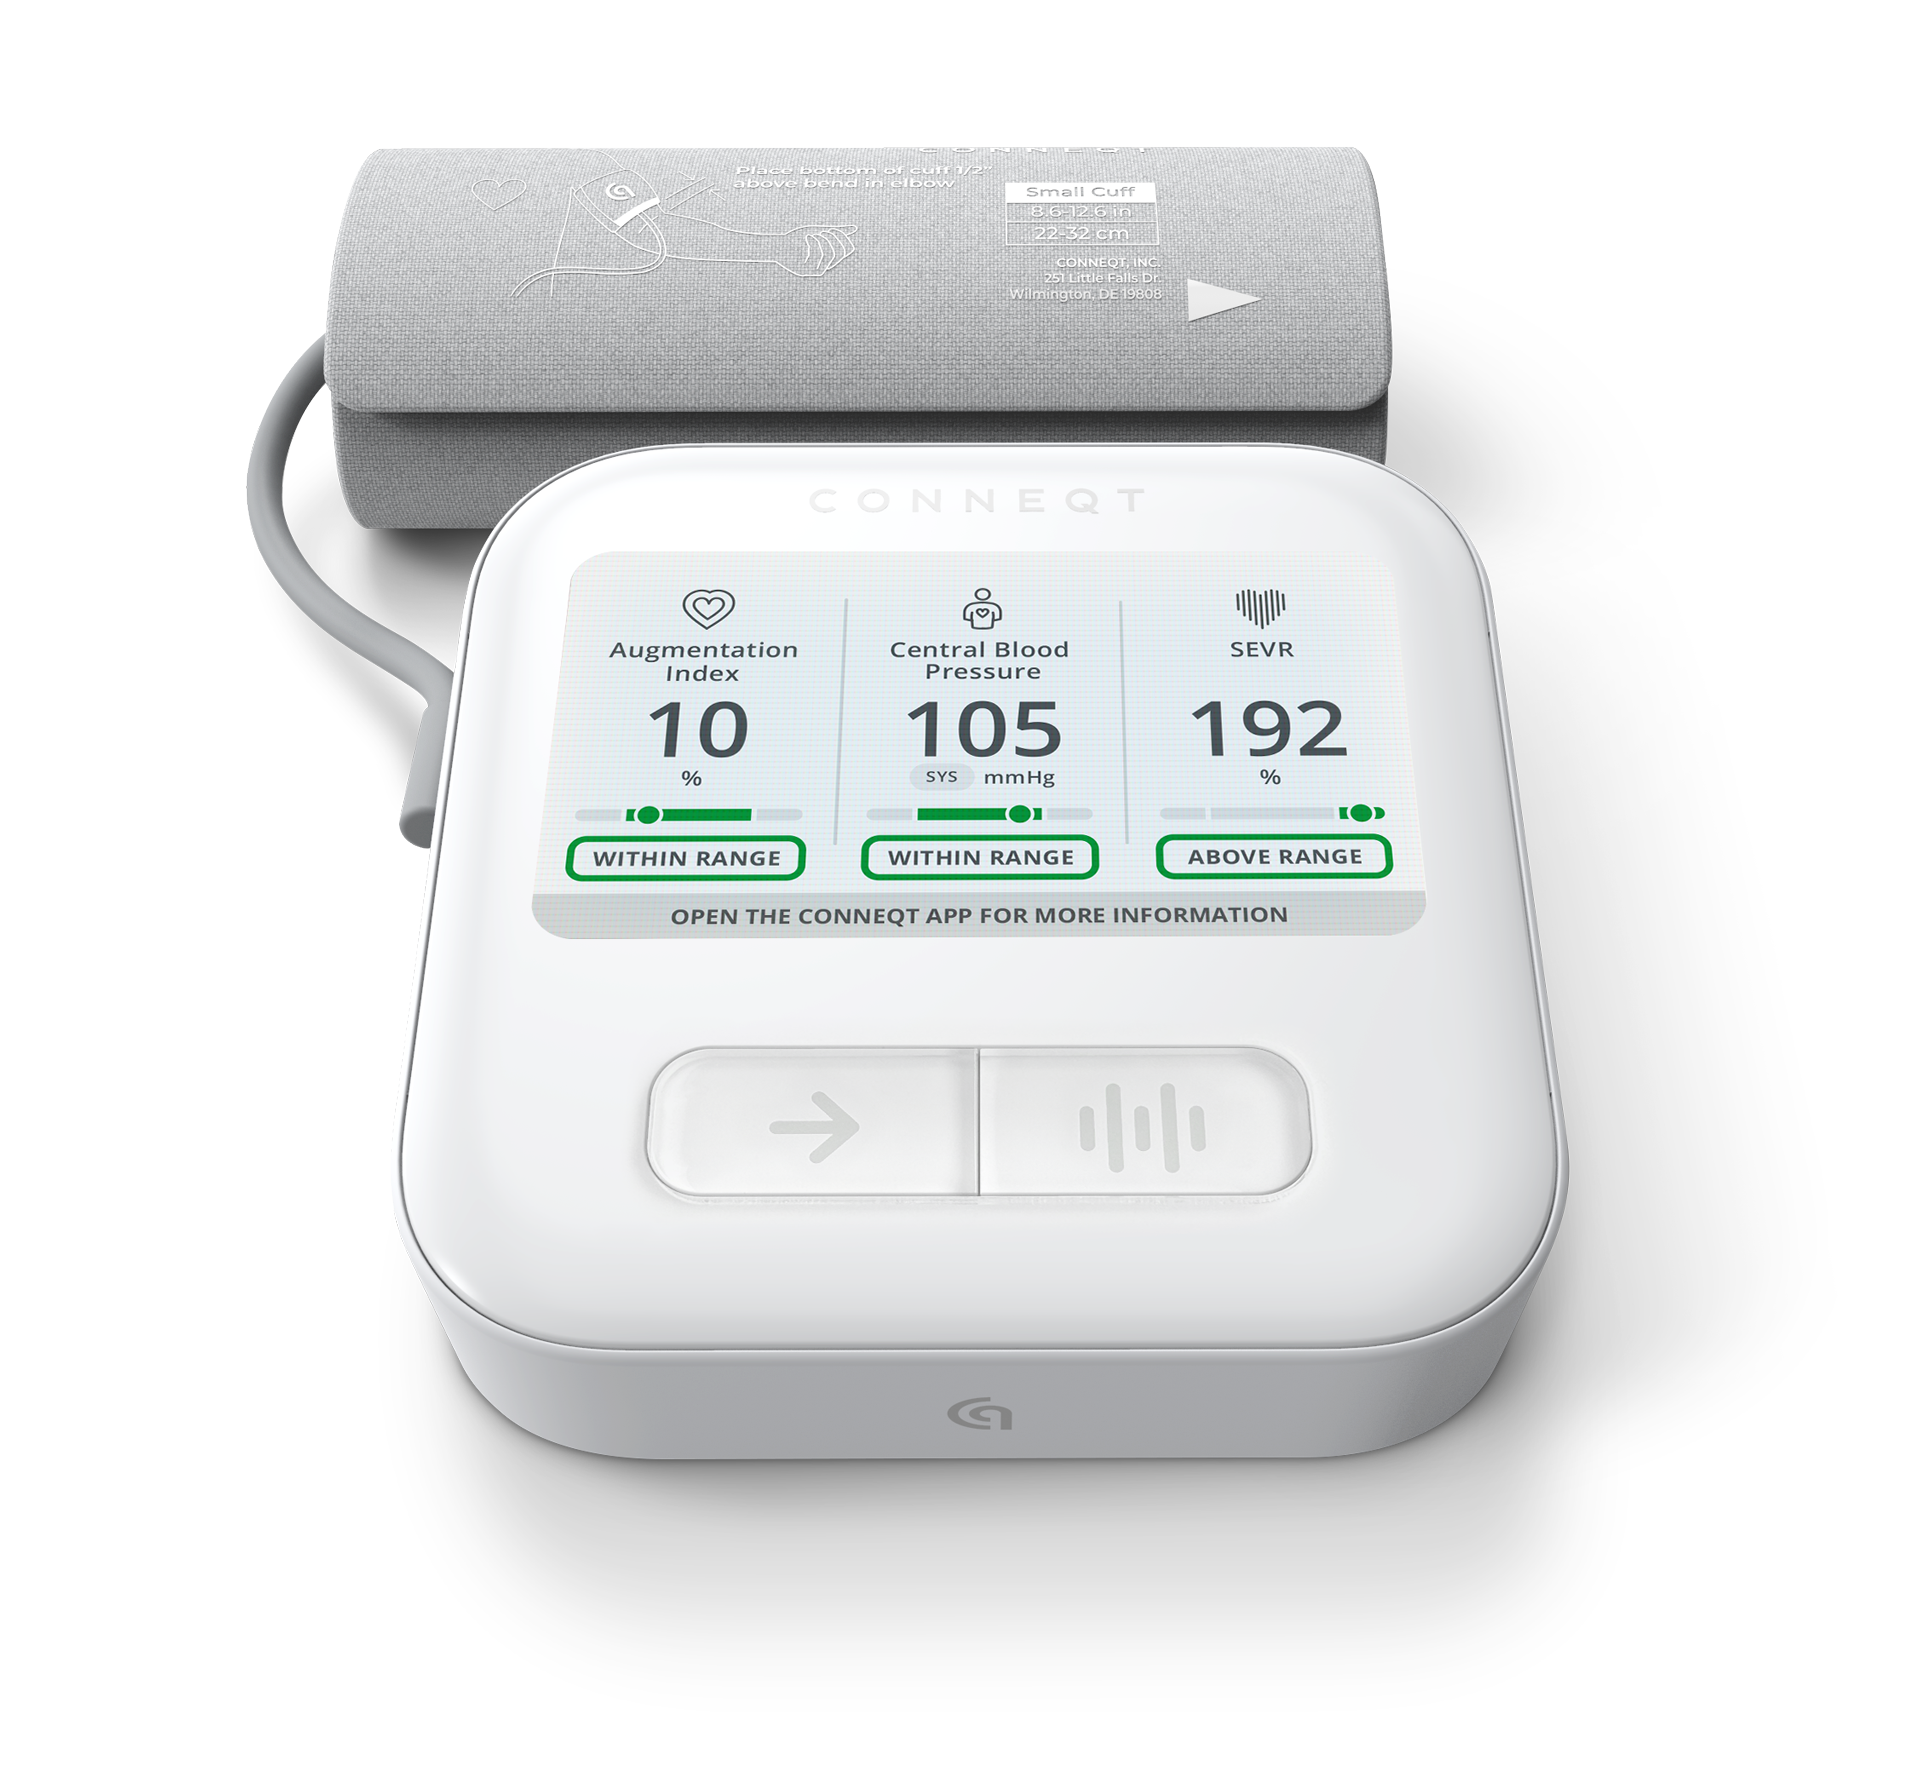
Every report you generate with the Pulse, whether it’s your Baseline, an On-Demand Report, or a full Cardiology Report, helps assess cardiovascular risk by classifying five key parameters into three categories. These parameters include central blood pressure (CBP), central pulse pressure (CPP), augmentation pressure (AP), augmentation index (AIx), and pulse pressure amplification (PPA).
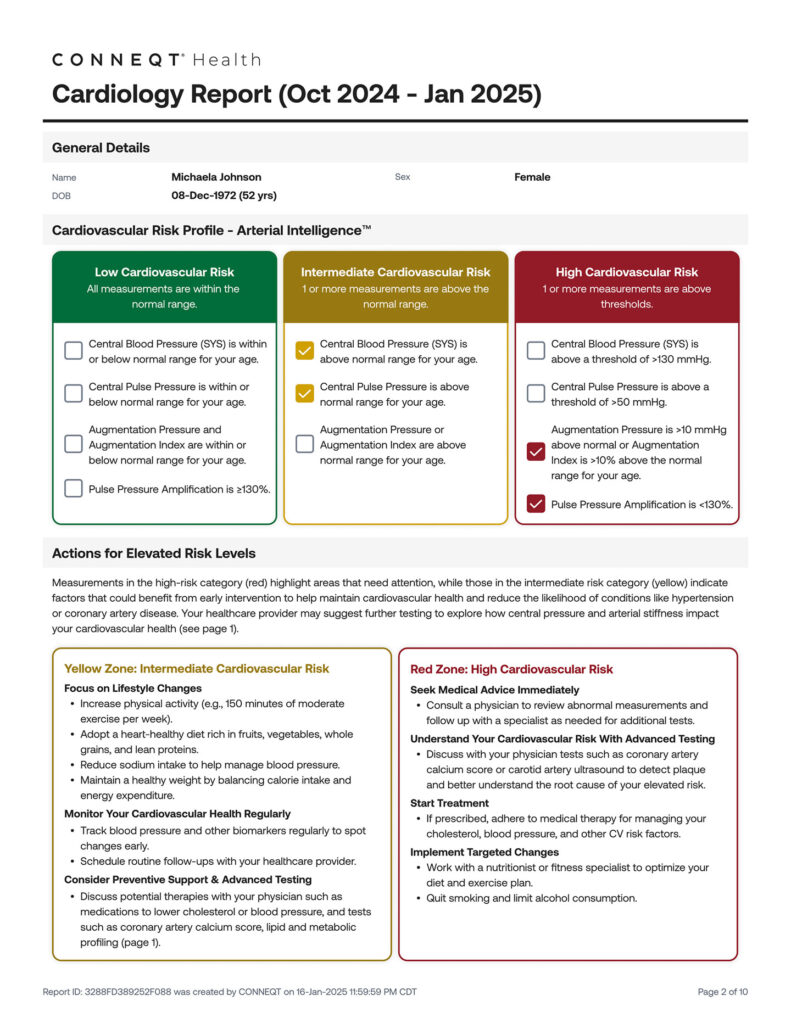
- Low Risk (Green) – Readings fall within expected ranges, indicating healthy arterial function and circulatory efficiency. Maintaining values in this range is a sign of good cardiovascular health.
- Intermediate Risk (Yellow) – Some values are slightly elevated, suggesting early signs of vascular aging or arterial stiffness. While not immediately concerning, these changes should be monitored over time. Lifestyle adjustments, such as improving diet, increasing physical activity, and managing stress, may help bring these readings back into the optimal range.
- High Risk (Red) – Readings exceed key thresholds, indicating a higher risk of cardiovascular disease. Persistently high values may signal increased arterial stiffness, higher heart strain, or circulatory inefficiency. A discussion with your physician may be necessary to explore potential interventions, such as medication, further testing, or targeted lifestyle changes.
By tracking these parameters over time, your reports highlight trends that may indicate an increased cardiovascular risk and give you the opportunity for early intervention when needed.
How Your Reports Fit into a Comprehensive Cardiovascular Assessment
Your Baseline, On-Demand, and Cardiology Reports provide critical insights into your heart and vascular health, but it can also be used alongside other medical tests to further evaluate cardiovascular risk.
Under your physician’s guidance, additional testing may help assess how central blood pressure and arterial stiffness contribute to conditions such as hypertension, coronary artery disease, kidney disease, vascular dementia, and sexual dysfunction. These tests may include:
- Coronary Artery Calcium Scoring – Measures calcium buildup in the arteries, helping detect early signs of plaque formation.
- Carotid Artery Ultrasound – Evaluates blood flow in the neck arteries to identify potential blockages.
- Advanced Cholesterol and Metabolic Profiling – Includes Lipid Particle Size, Lp(a), hsCRP, ApoB, and markers of insulin resistance.
- Artificial Intelligence Coronary Plaque Phenotyping – Uses AI technology to analyze plaque composition and predict cardiovascular risk.
Your Physician Summary: A Clear Picture for Your Doctor
Every report you generate with the Pulse, whether it is your Baseline Report, an On-Demand Report, or a full Cardiology Report, includes a structured physician summary. This section organizes your results so your doctor can quickly assess trends, identify changes, and make informed decisions about your cardiovascular health.
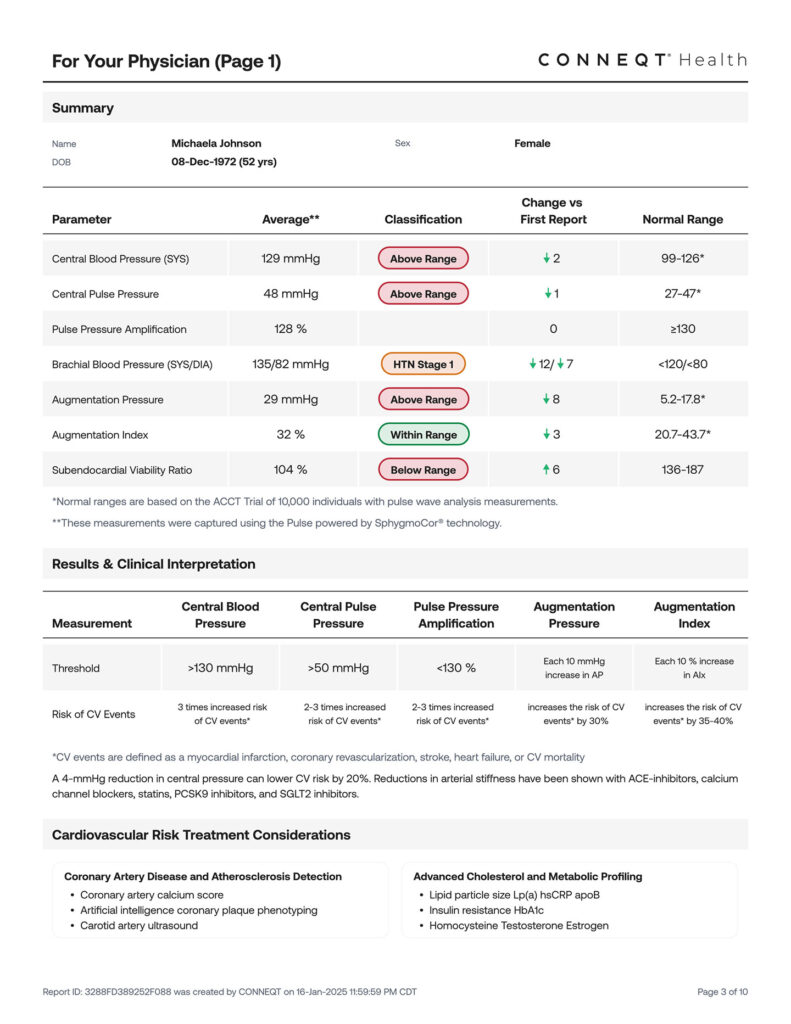
- Average readings for each parameter over the report period – Offers a more stable, long-term view instead of relying on isolated measurements.
- Classification for applicable parameters – CBP, CPP, AP, AIx, and SEVR are categorized as below range, within range, or above range. Brachial blood pressure is classified according to standard hypertension stages, while PPA is categorized as either below range or normal.
- Changes from the first report – Indicates whether each parameter has increased, decreased, or remained stable.
- Normal reference range for each parameter – Helps contextualize results based on age, sex, and overall cardiovascular profile.
- Cardiovascular risk considerations – Explains how trends in arterial stiffness, central pressure, and circulatory efficiency relate to increased cardiovascular event risk, including heart attack, stroke, and heart failure.
- Further evaluation and treatment considerations – Recommends additional assessments such as coronary artery calcium scoring, carotid artery ultrasound, and advanced cholesterol and metabolic profiling for patients with elevated cardiovascular risk.
Your Physician Summary Includes:
- Average readings for each parameter over the report period – Offers a more stable, long-term view instead of relying on isolated measurements
- Classification for applicable parameters – CBP, CPP, AP, AIx, and SEVR are categorized as below range, within range, or above range. Brachial blood pressure is classified according to standard hypertension stages, while PPA is categorized as either below range or normal.
- Changes from the first report – Indicates whether each parameter has increased, decreased, or remained stable.
- Normal reference range for each parameter – Helps contextualize results based on age, sex, and overall cardiovascular profile.
- Cardiovascular risk considerations – Explains how trends in arterial stiffness, central pressure, and circulatory efficiency relate to increased cardiovascular event risk, including heart attack, stroke, and heart failure.
- Further evaluation and treatment considerations – Recommends additional assessments such as coronary artery calcium scoring, carotid artery ultrasound, and advanced cholesterol and metabolic profiling for patients with elevated cardiovascular risk.
How to Use Your Physician Summary at Your Next Visit
Your reports are valuable tools to help guide conversations with your physician about your cardiovascular health. At your next appointment, bring your latest report and:
- Review trends together – Are your numbers improving, stable, or shifting in a direction that requires action?
- Discuss next steps – Based on your trends, should you adjust your lifestyle, consider further testing, or explore treatment options?
- Make informed health decisions – Use your report to track progress, set goals, and develop a plan that supports long-term cardiovascular health.
You can share any report directly from the CONNEQT App using the share button. This allows you to print, email, or send the report digitally to your doctor, a family member, or anyone helping you manage your health. This way, the people supporting you always have access to the most up-to-date insights.
Why Taking Multiple Readings is Necessary
A single reading doesn’t tell the full story of your cardiovascular health. To get an accurate picture, it’s essential to take multiple readings over time. The American Heart Association recommends taking two to three consecutive readings in a row and averaging them for the most reliable results. Reports are built on these consistent inputs rather than isolated data, making patterns easier to recognize and act on.
Self-Monitoring for Better Accuracy
Regular readings provide deeper insights into your cardiovascular health by:
- Identifying trends in arterial stiffness – Understanding how your arteries change over time helps detect early signs of vascular aging.
- Evaluating the impact of lifestyle changes – Tracking how diet, exercise, and medications affect your cardiovascular health ensures adjustments are working.
- Minimizing daily fluctuations – A single high reading can be misleading, but trend tracking ensures decisions are based on consistent data.
How to Build a Self-Monitoring Routine
- Measure at the same time each day—Morning and evening readings provide the most consistent data.
- Take three readings per session—This helps calculate an accurate daily average.
- Track results in the CONNEQT App—The more data you collect, the more useful your reports become.
Your Cardiovascular Health, Informed & In Control
Your reports are more than numbers. They are tools for taking control of your cardiovascular health. By reviewing results over time, you gain the ability to spot patterns, measure progress, and take proactive steps to protect your heart.
With every report, you are not just recording readings. You are gaining insights that can help you optimize your cardiovascular future.
Your journey toward Arterial Intelligence™ starts here.


