


My imaging came back clean. My blood markers didn’t. Understanding why that’s not a contradiction is what made me think about arterial health in three distinct layers.
You’ve probably heard of a calcium score.
You may have heard of a CT angiogram, or a service like Cleerly that uses AI to analyze one.

Medical Grade, Accurate, FDA-Cleared Heart Insights.
Save 20% on checkout with code VITALITY
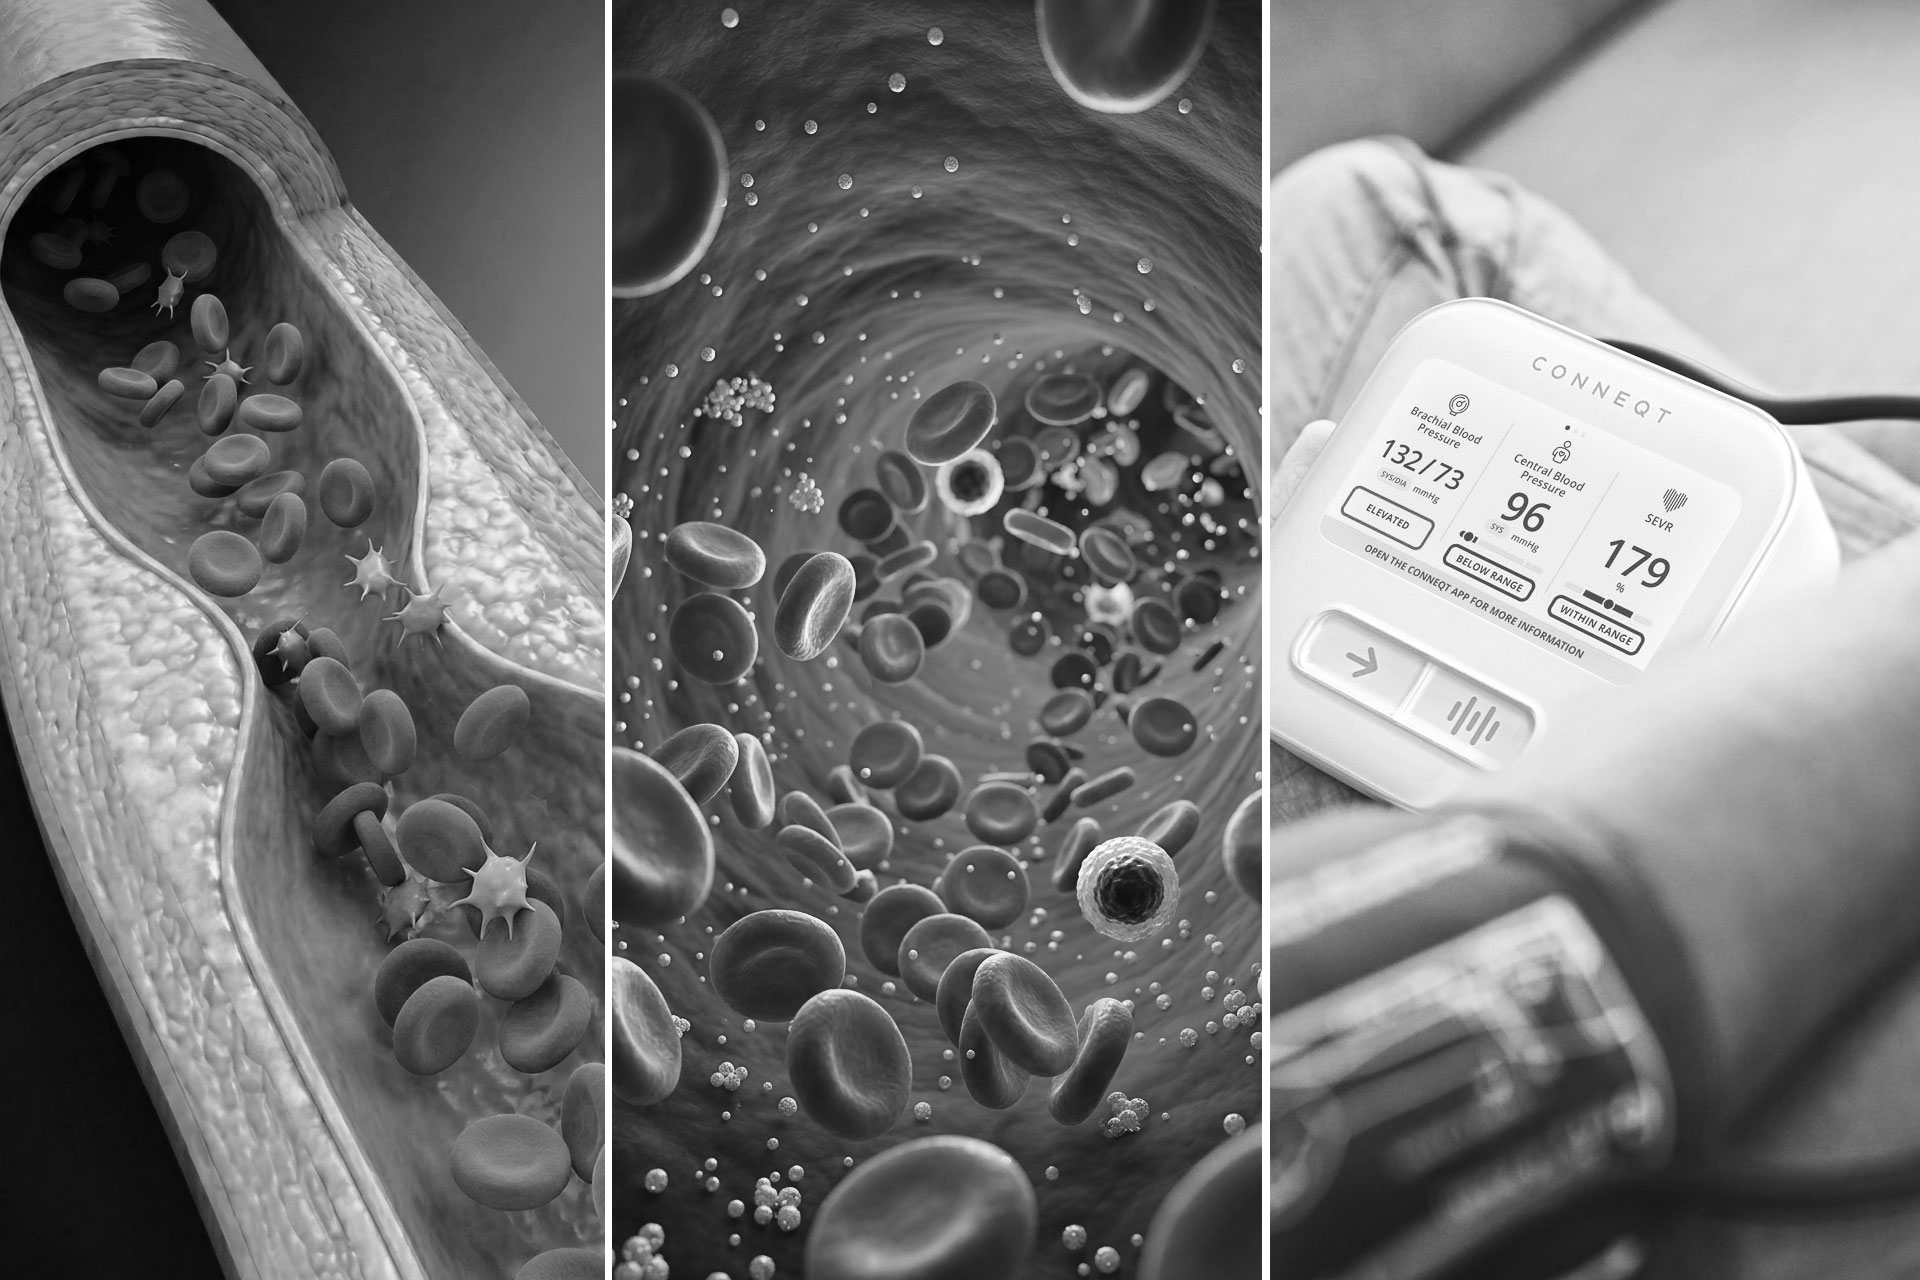
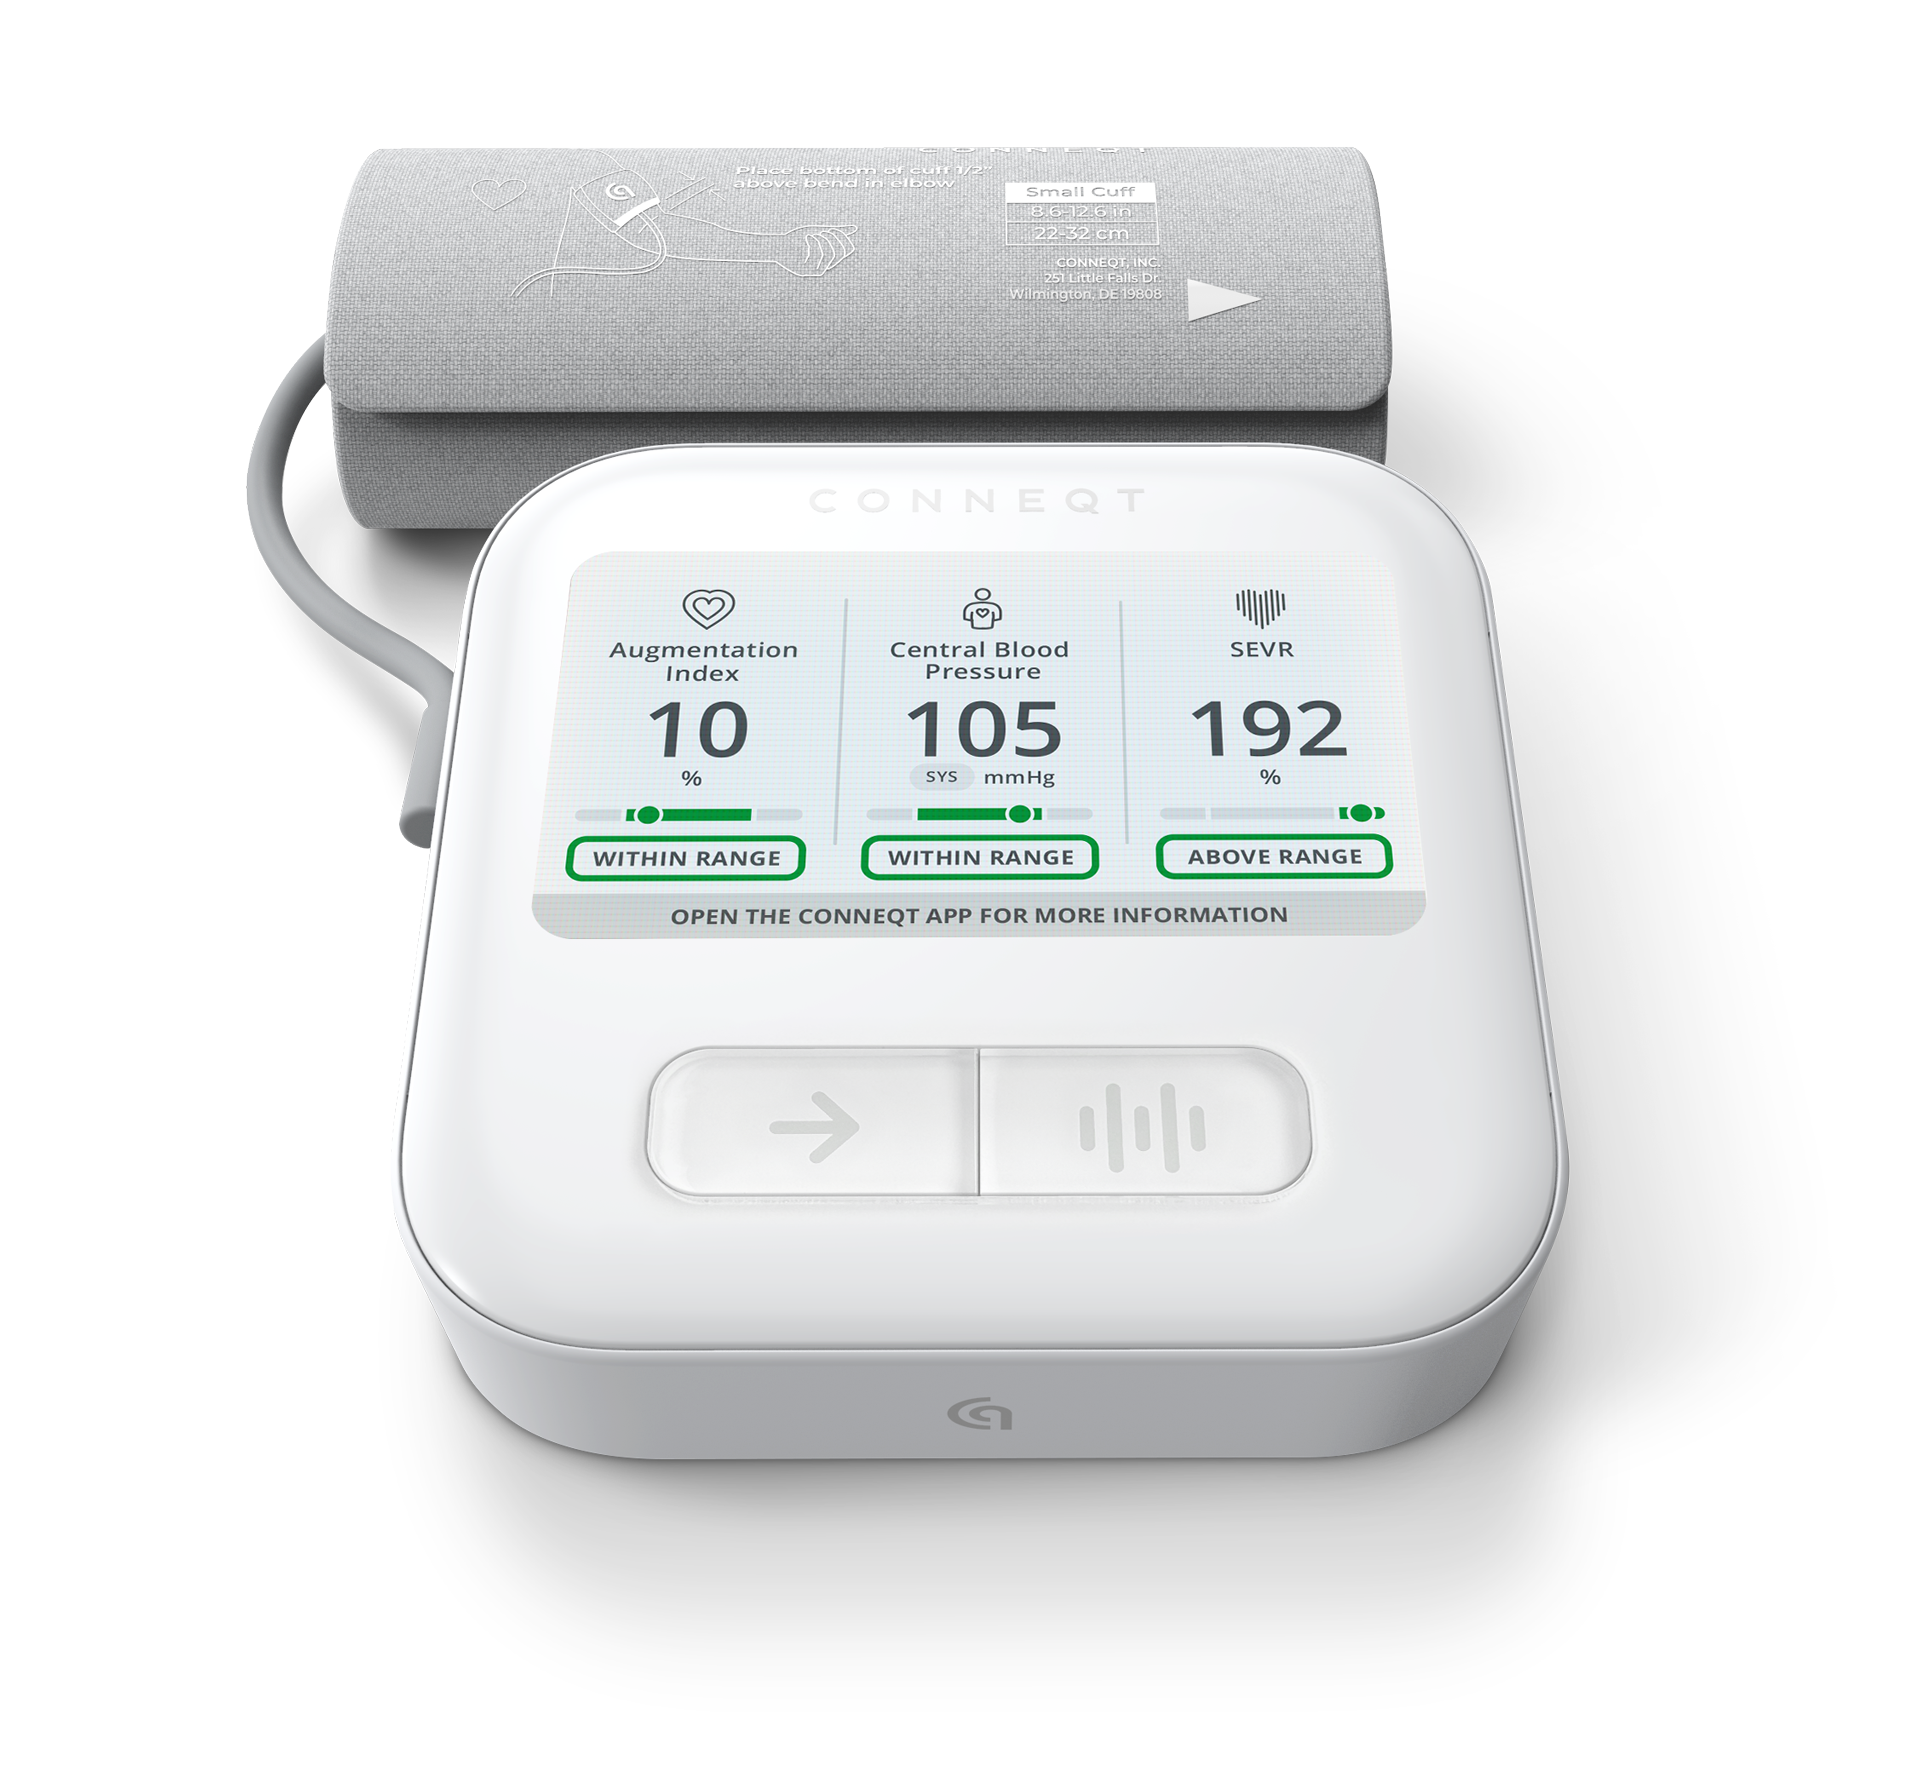
And now there are devices, like the CONNEQT Pulse, that measure arterial function at home.
Most people treat these as variations on the same thing. They’re not.
They’re looking at completely different aspects of your cardiovascular health. And in my experience, most people, including people who are actively engaged with their health, are missing at least one of the three.
I think about cardiovascular health in three distinct layers.
Structure. What has physically accumulated inside your arteries.
Flow. What is circulating in your bloodstream right now and driving future risk.
Function. How your arterial wall is actually behaving under pressure, every single heartbeat.
My own recent results are what pushed me to think through all three more carefully. My imaging came back clean. My blood markers didn’t. And that apparent contradiction is exactly what made the third layer so important to understand.
But first, it’s worth understanding what each layer actually measures. Because that’s what makes the combination so important.
If you want the full context on my results and what I’m doing about them, start here: My Cardiovascular Risk is High, Even Though I’m Fit. Here’s What I’m Doing About It. Then come back.
The first layer: structure
This is where most people start. And for good reason.
Imaging tells you what is physically inside your arteries. How much plaque has accumulated, where it is, and what type it is. That is genuinely useful information. But it is not all the same information, and the tools that generate it are not interchangeable.
There are two distinct imaging approaches worth understanding.
The calcium score
A CAC scan looks for calcified plaque in your coronary arteries.
Think of it as a measure of past damage. If your score is high, you have had years, sometimes decades, of plaque development already. The process started long before the scan picked it up.
That signal is worth taking seriously. A high score tells you something real about your cardiovascular history. A score of zero, in the right population, is generally reassuring.
But the limitation matters. A CAC scan only sees calcified plaque. It does not see early-stage soft plaque. It does not tell you about blood flow. And it tells you nothing about how your arteries are actually functioning right now.
A 2024 case report published in JACC makes this concrete. A patient with a CAC score of zero turned out to have a severely narrowed artery from soft plaque that had not yet calcified. The scan showed nothing because the plaque had not hardened.
There is something else worth naming here. Once plaque has calcified, it cannot be reversed. A CAC score is not measuring something you can undo. That plaque is set in stone, literally. The damage is done. Which is exactly why catching the process earlier, before calcification, matters so much.
If you want to understand how exercise specifically affects your calcium score, this is worth reading: The Truth About Exercise and Calcium Scores: What the Latest Research Says.
The CT angiogram and Cleerly analysis
A CT angiogram goes further.
It uses contrast dye and detailed imaging to look at both calcified and noncalcified plaque. Where it is, how much there is, whether it is narrowing the arteries. A service like Cleerly takes that further still, using AI analysis to quantify plaque burden, characterize plaque type, and build a risk profile.
This is a more complete picture of what is physically inside your arteries right now, not just what has hardened over time.
That distinction matters. Noncalcified plaque, the soft, earlier-stage kind, is most associated with rupture risk. It is the plaque that can destabilize and cause a heart attack. And it is completely invisible to a CAC scan.
My recent Cleerly scan showed zero obstructive disease and zero plaque. On the surface, that looks reassuring.
But here is where the structure layer reaches its limit.
Imaging tells you what has accumulated. It does not tell you what is driving accumulation right now. And it tells you nothing about whether your arteries are equipped to handle what is coming.
That is what the other two layers are for.
CT scan, CAC scan, and MRI: what’s the difference?
Now that we’ve covered both a CAC scan and a CT angiogram, it’s worth clarifying how these relate to each other, and to MRI, which more people have heard of.
Both a CAC scan and a CT angiogram are CT-based technologies. They use X-rays. The difference is what they’re looking for: a CAC scan identifies calcified plaque only, while a CT angiogram uses contrast dye to visualize the full arterial anatomy, including soft plaque.
An MRI is a completely different technology. It uses magnets and radio waves rather than X-rays, takes longer (30 to 60 minutes), and is better suited for soft-tissue imaging. It’s not typically used for coronary artery assessment.
The second layer: flow
Imaging tells you what has accumulated in your arteries.
It does not tell you what is driving that accumulation right now. For that, you need to look at what is circulating in your bloodstream.
This is the flow layer. And it is where my own results got interesting.
What blood markers are actually measuring
The standard lipid panel most people get measures LDL cholesterol. That number has value. But it misses something important.
ApoB is a more precise signal. It measures the number of cholesterol-carrying particles circulating in your bloodstream, not just the cholesterol they contain. Each of those particles has the potential to penetrate the arterial wall and contribute to plaque formation. More particles means more exposure. More exposure means more ongoing risk.
My ApoB came back at 110 mg/dL. Well above the under-80 mg/dL target cited for cardiovascular risk reduction.
My LDL-C is elevated too.
At the same time, my Cleerly scan showed zero plaque burden. Zero obstructive disease.
That looks like a contradiction. It isn’t.
Why imaging and blood markers can point in different directions
A Cleerly scan is a snapshot. It tells you what has accumulated in your arteries up to this point in time.
ApoB tells you something different. It reflects how many atherogenic particles are circulating right now. How much ongoing exposure your arterial wall is receiving. Not what has built up. What is building.
The National Lipid Association’s 2024 clinical consensus makes this point directly: elevated ApoB signals atherogenic particle burden even when imaging shows low plaque burden at a given point in time.
So you can have clean imaging today and still have elevated particle traffic that continues to drive risk going forward.
That is my situation.
Imaging says the structure looks good right now. Blood markers say the process driving future structural damage is active.
Which raises the question I kept coming back to.
What direction is this actually heading?
That is what the third layer is designed to help answer.
The third layer: function
Structure tells you what has accumulated.
Flow tells you what is driving accumulation right now.
Neither one tells you how your arteries are actually holding up under that pressure. How stiff they are. How hard your heart is working to push blood through them. Whether the arterial wall itself is resilient or compromised.
That is the function layer. And it is the one most people have never measured.
What arterial function actually measures
Technologies like SphygmoCor® and the CONNEQT Pulse measure the mechanical behavior of the arterial wall in real time. Not what is inside it. Not what is circulating. How it is responding to every heartbeat.
Specifically:
Arterial stiffness, measured as pulse wave velocity. How fast a pressure wave travels through the arterial wall. A stiffer artery transmits that wave faster. A more elastic artery absorbs and dampens it.
Central blood pressure. The pressure closer to the heart and aorta. This can differ meaningfully from what is measured at the arm, and it is a more direct measure of the load your heart and arteries are carrying.
Wave reflections and augmentation index. How efficiently the heart is pumping and how much extra pressure load is being placed on it with each beat.
A landmark 2010 meta-analysis published in JACC found that pulse wave velocity independently predicted cardiovascular events and all-cause mortality.
A companion meta-analysis published the same year in the European Heart Journal established that central blood pressure and augmentation index are independently predictive of cardiovascular outcomes as well.
These are not soft signals. They are measuring real forces acting on the arterial wall with every heartbeat.
Why stiff arteries matter beyond the pressure reading
Here is something most people do not know.
Arterial stiffness is not just a consequence of cardiovascular disease. It is a driver of it.
When arteries lose elasticity, the pressure wave from each heartbeat travels faster and reflects back toward the heart earlier than it should. That reflected wave arrives while the heart is still contracting, adding to the load the heart has to work against. Over time, that extra load contributes to left ventricular hypertrophy, elevated central blood pressure, and accelerated wear on the arterial wall.
But there is a second mechanism that matters just as much.
Stiff, inelastic arteries are more vulnerable to plaque formation. A healthy elastic artery absorbs the mechanical stress of each heartbeat. A stiff one transmits that stress directly to the arterial wall. That repeated mechanical stress damages the endothelium, the inner lining of the artery. Damaged endothelium is where plaque formation begins.
This is why arterial stiffness sits earlier in the disease process than imaging can detect. The stiffening creates the conditions for plaque to accumulate. By the time a CAC scan picks up calcified plaque, arterial stiffness has often been elevated for years.
Monitoring function is how you see that process before it shows up on a scan.
What this means for my situation
My imaging is clean. My particle traffic is elevated.
The question that matters now is whether my arterial wall is resilient enough to handle that ongoing exposure, or whether the conditions for plaque formation are already developing.
That is exactly what arterial function measurement is designed to track.
SphygmoCor technology is the clinical gold standard for this assessment. It has been used in research and clinical settings worldwide for over twenty years. The CONNEQT Pulse uses the same pulse wave analysis technology to track central blood pressure and arterial stiffness consistently over time, at home. Not as a diagnostic tool. As a way to build visibility into what direction things are heading.
Which is precisely the question I am trying to answer.
Why you need all three
Each of these layers is useful on its own.
None of them tells the complete story.
That is what my own results made clear. Not that any single test was wrong. But each one was answering a different question. And I needed all three questions answered to understand what was actually going on.
What each layer is actually telling you
The structure layer tells you about past and present plaque burden. What has calcified over years or decades. What has accumulated but not yet hardened. It is a picture of what is physically inside your arteries at a given point in time. Damage already done that is mostly irreversible.
The flow layer tells you about ongoing risk. How many atherogenic particles are circulating right now. How much exposure your arterial wall is receiving with every pass of blood through the system. Not what has built up. What is building.
The function layer tells you how your arteries are holding up under that pressure. How stiff they are. How hard your heart is working. Whether the arterial wall itself is resilient or already compromised. And critically, whether the conditions for future plaque formation are developing right now.
Three questions. Three different answers. All of them necessary.
And in my case
My structure layer looks good. Zero plaque burden on imaging.
My flow layer say risk is present. ApoB elevated. LDL-C elevated. Particle traffic is high and ongoing.
So the question I kept coming back to is not where things stand today. Whether my arterial wall is resilient enough to handle that ongoing particle exposure, or whether the conditions for plaque formation are quietly developing.
That is the question the function layer is designed to answer.
And it is the reason I think about cardiovascular health in three layers rather than one test result.
The complete picture
Structure. Flow. Function.
What has accumulated. What is driving accumulation. How your arteries are holding up under that pressure.
You need all three because cardiovascular disease does not announce itself with a single signal. It develops across multiple systems simultaneously. A calcium score can look reassuring while particle traffic is elevated. Blood markers can look concerning while imaging is clean. Both can look manageable while arterial stiffness is quietly building the conditions for future damage.
The goal is not to find the one test that tells you everything. It is to build a picture complete enough to see what direction things are actually heading.
Longevity doesn’t start when something breaks. It starts with understanding what’s changing early, what’s driving it, and what you can do about it.
Because what you can measure early, you can change.
What to read next
If you want to go deeper, these articles connect directly to what this piece covered:
- My Cardiovascular Risk is High, Even Though I’m Fit. Here’s What I’m Doing About It. – A real-world look at elevated ApoB in someone who looks healthy on paper, and what he’s doing about it.
- Early Signs of Arterial Stiffness: What Changes Before Symptoms Appear – A complete guide to what happens in the arterial wall before symptoms appear and what consistent measurement can reveal.
- Fit, Healthy, and Still at Risk? What ApoB Reveals That LDL Misses – What ApoB actually measures, why it can diverge from LDL, and what to do with that information.
Want to explore more heart health articles? Browse the full library.


