


A blood pressure reading means something different at 60 than it did at 40. Here is what changes in your arteries with age, and why the number alone doesn’t tell the full story.
You have probably been measuring your blood pressure for years.
You know roughly what your numbers look like. But lately, something has shifted.

Medical Grade, Accurate, FDA-Cleared Heart Insights.
Save 10% on checkout with code VITALITY
The systolic is higher than it used to be. Or maybe the diastolic has drifted lower. Or the reading at your doctor’s office looks different from the one you took at home that morning.
Nothing is obviously wrong. But the numbers feel harder to make sense of than they did ten years ago.
That experience may feel like confusion, but it isn’t. It reflects something real about how blood pressure changes with age, and what those changes mean for how you interpret the numbers.
Blood pressure does not just fluctuate from moment to moment. The arterial machinery behind it changes structurally over time, and those structural changes alter what the numbers are actually telling you.
This article is not about whether a single reading can mislead you. If that is what you are trying to work out, we have covered it in detail in our guide to why blood pressure readings fluctuate. This is about a deeper question: why the same reading can carry different clinical meanings depending on your age and what your arteries are doing.
Why age changes what a blood pressure reading tells you
A standard blood pressure reading captures one signal at one point in the arterial system: the pressure in the artery running through your upper arm.
That measurement is real and useful. It has been the clinical standard for decades.
But it is a peripheral measurement. It does not capture the pressure your heart, brain, and kidneys actually experience, which is determined closer to the aorta. That difference matters because the pressure those organs experience, what researchers call central blood pressure, can tell you things your arm reading cannot. If you want to understand that distinction in more depth, this article goes into it fully.
Age adds a layer to all of this.
As the arterial wall changes over time, the relationship between what your cuff measures and what your cardiovascular system is actually doing becomes less predictable. Not wrong. Harder to interpret in isolation.
What happens to blood pressure after 50
For most of adult life, systolic and diastolic blood pressure tend to rise together. The arterial wall is still relatively elastic. It stretches and recoils with each heartbeat, buffering the pressure wave before it travels downstream.
That pattern shifts somewhere in the fifth decade of life.
Research tracking adults across decades has documented a consistent divergence. Systolic blood pressure continues to climb. Diastolic blood pressure plateaus and then begins to fall. The gap between the two numbers, what clinicians call pulse pressure, widens.
That widening is not a measurement artifact. It reflects a structural change in the arterial wall itself.
The pulse pressure signal
Pulse pressure is the difference between your systolic and diastolic readings. A reading of 130/80 gives you a pulse pressure of 50. A reading of 145/75 gives you a pulse pressure of 70.
A widening pulse pressure over time is one of the clearest signals that the arterial wall is becoming less elastic. It does not appear on a standard blood pressure chart. But it is visible in your own numbers if you track them consistently over months and years.
As the arterial wall stiffens, it loses the capacity to absorb and smooth the pressure surge that follows each heartbeat. The systolic peak rises because the stiffened wall pushes back against the heart’s contraction rather than giving way. The diastolic falls because less stored energy is released between beats.
The result is a pattern researchers have documented clearly: in many older adults, systolic blood pressure rises while diastolic blood pressure falls, even without any change in medication, lifestyle, or underlying disease. The numbers are moving in opposite directions because something has changed in the arterial wall. That change matters. It is not a benign feature of aging.
This pattern has a clinical name: isolated systolic hypertension. It is the most common form of hypertension in adults over 60, and the arterial changes that lead to it often begin a decade earlier. ISH carries significant cardiovascular risk, including higher rates of stroke, heart failure, and cognitive decline. A systolic number alone does not fully convey that risk, because the falling diastolic is part of the story too.
Why blood pressure readings differ between home and clinic
A reading taken at the doctor’s office and a reading taken at home measure the same thing.
But they do not always agree.
That gap has two names, depending on which direction it runs. When blood pressure is elevated at the clinic but normal at home, it is called white coat hypertension. The clinical setting itself triggers a stress response, even in people who feel calm, and that response drives the reading up. When it is normal at the clinic but elevated at home, it is called masked hypertension.
Neither is rare, and both become more common as you get older.
Masked hypertension is the more consequential of the two.
The reason is straightforward: a person with masked hypertension looks fine on the standard clinical measurement. But their blood pressure is genuinely elevated in their daily life, and the clinic reading never captures it.
What drives the gap is almost the mirror image of white coat hypertension. The calm clinical environment produces a lower reading than the person’s real-world baseline. Outside the clinic, daily stressors, physical activity, and other behavioral demands push the reading higher.
The clinic catches them at rest. It misses what their cardiovascular system is doing the rest of the time. Research consistently shows that people with masked hypertension face a significantly higher risk of cardiovascular events than people whose readings are normal in both settings. The standard clinical reading alone would not have told them that.
Why age amplifies the gap
Age raises the stakes here for a specific reason.
As the arterial wall stiffens, blood pressure becomes more reactive. It responds more sharply to stress, posture, time of day, and the simple act of having it measured in a clinical setting. The same physiological changes we described earlier also make readings more variable and more context-dependent.
This is why blood pressure variability is an independent predictor of cardiovascular risk in older adults. It is not just the average reading that matters. How much the reading moves across settings and across time is a signal in its own right, one that a single clinic measurement cannot capture.
A reading taken once, in one setting, at one moment in time, tells you less about your cardiovascular health at 65 than it did at 45. Not because the measurement is broken. Because the arterial system it is measuring has become more dynamic.
What a more useful monitoring approach looks like
The answer to a more dynamic arterial system is not a different reading. It is more of them, taken consistently over time.
The 2025 ACC/AHA guideline on home monitoring is straightforward: two readings per session, one minute apart, at the same time each day, with both results recorded. Major European cardiovascular guidelines, including the 2024 ESC and 2023 ESH guidelines, have reached the same conclusion. At-home monitoring is no longer a niche recommendation. It is a global clinical standard for accurate diagnosis and tracking.
Not because precision requires it, but because that pattern is what separates a meaningful measurement from a snapshot. If you want to go deeper on the mechanics of how to take a consistent reading, our full guide is here.
What structured monitoring gives you that a clinic reading cannot is a picture of your blood pressure across contexts: at rest in the morning, in the evening, across different days.
That pattern is what makes masked hypertension visible. It is also what gives your clinician something genuinely useful to work with rather than a single number taken on one morning in one setting.
One question worth asking your clinician at your next appointment: is my blood pressure being assessed in more than one setting? If the answer is no, and if your readings at home look different from the ones on file, that discrepancy is worth discussing.
The age-related changes this article has described, the widening pulse pressure, the increasing reactivity, the greater prevalence of masked hypertension, all of them make at-home measurement more valuable over time, not less.
Seeing what a blood pressure cuff alone cannot show you
A brachial cuff captures one signal at one point in the arterial system.
That signal is worth tracking, and the structured home monitoring approach this article has outlined is worth doing. But the age-related changes this article has described, the widening pulse pressure, the increasing reactivity, the growing gap between clinic and home readings, all happen upstream of what the cuff measures.
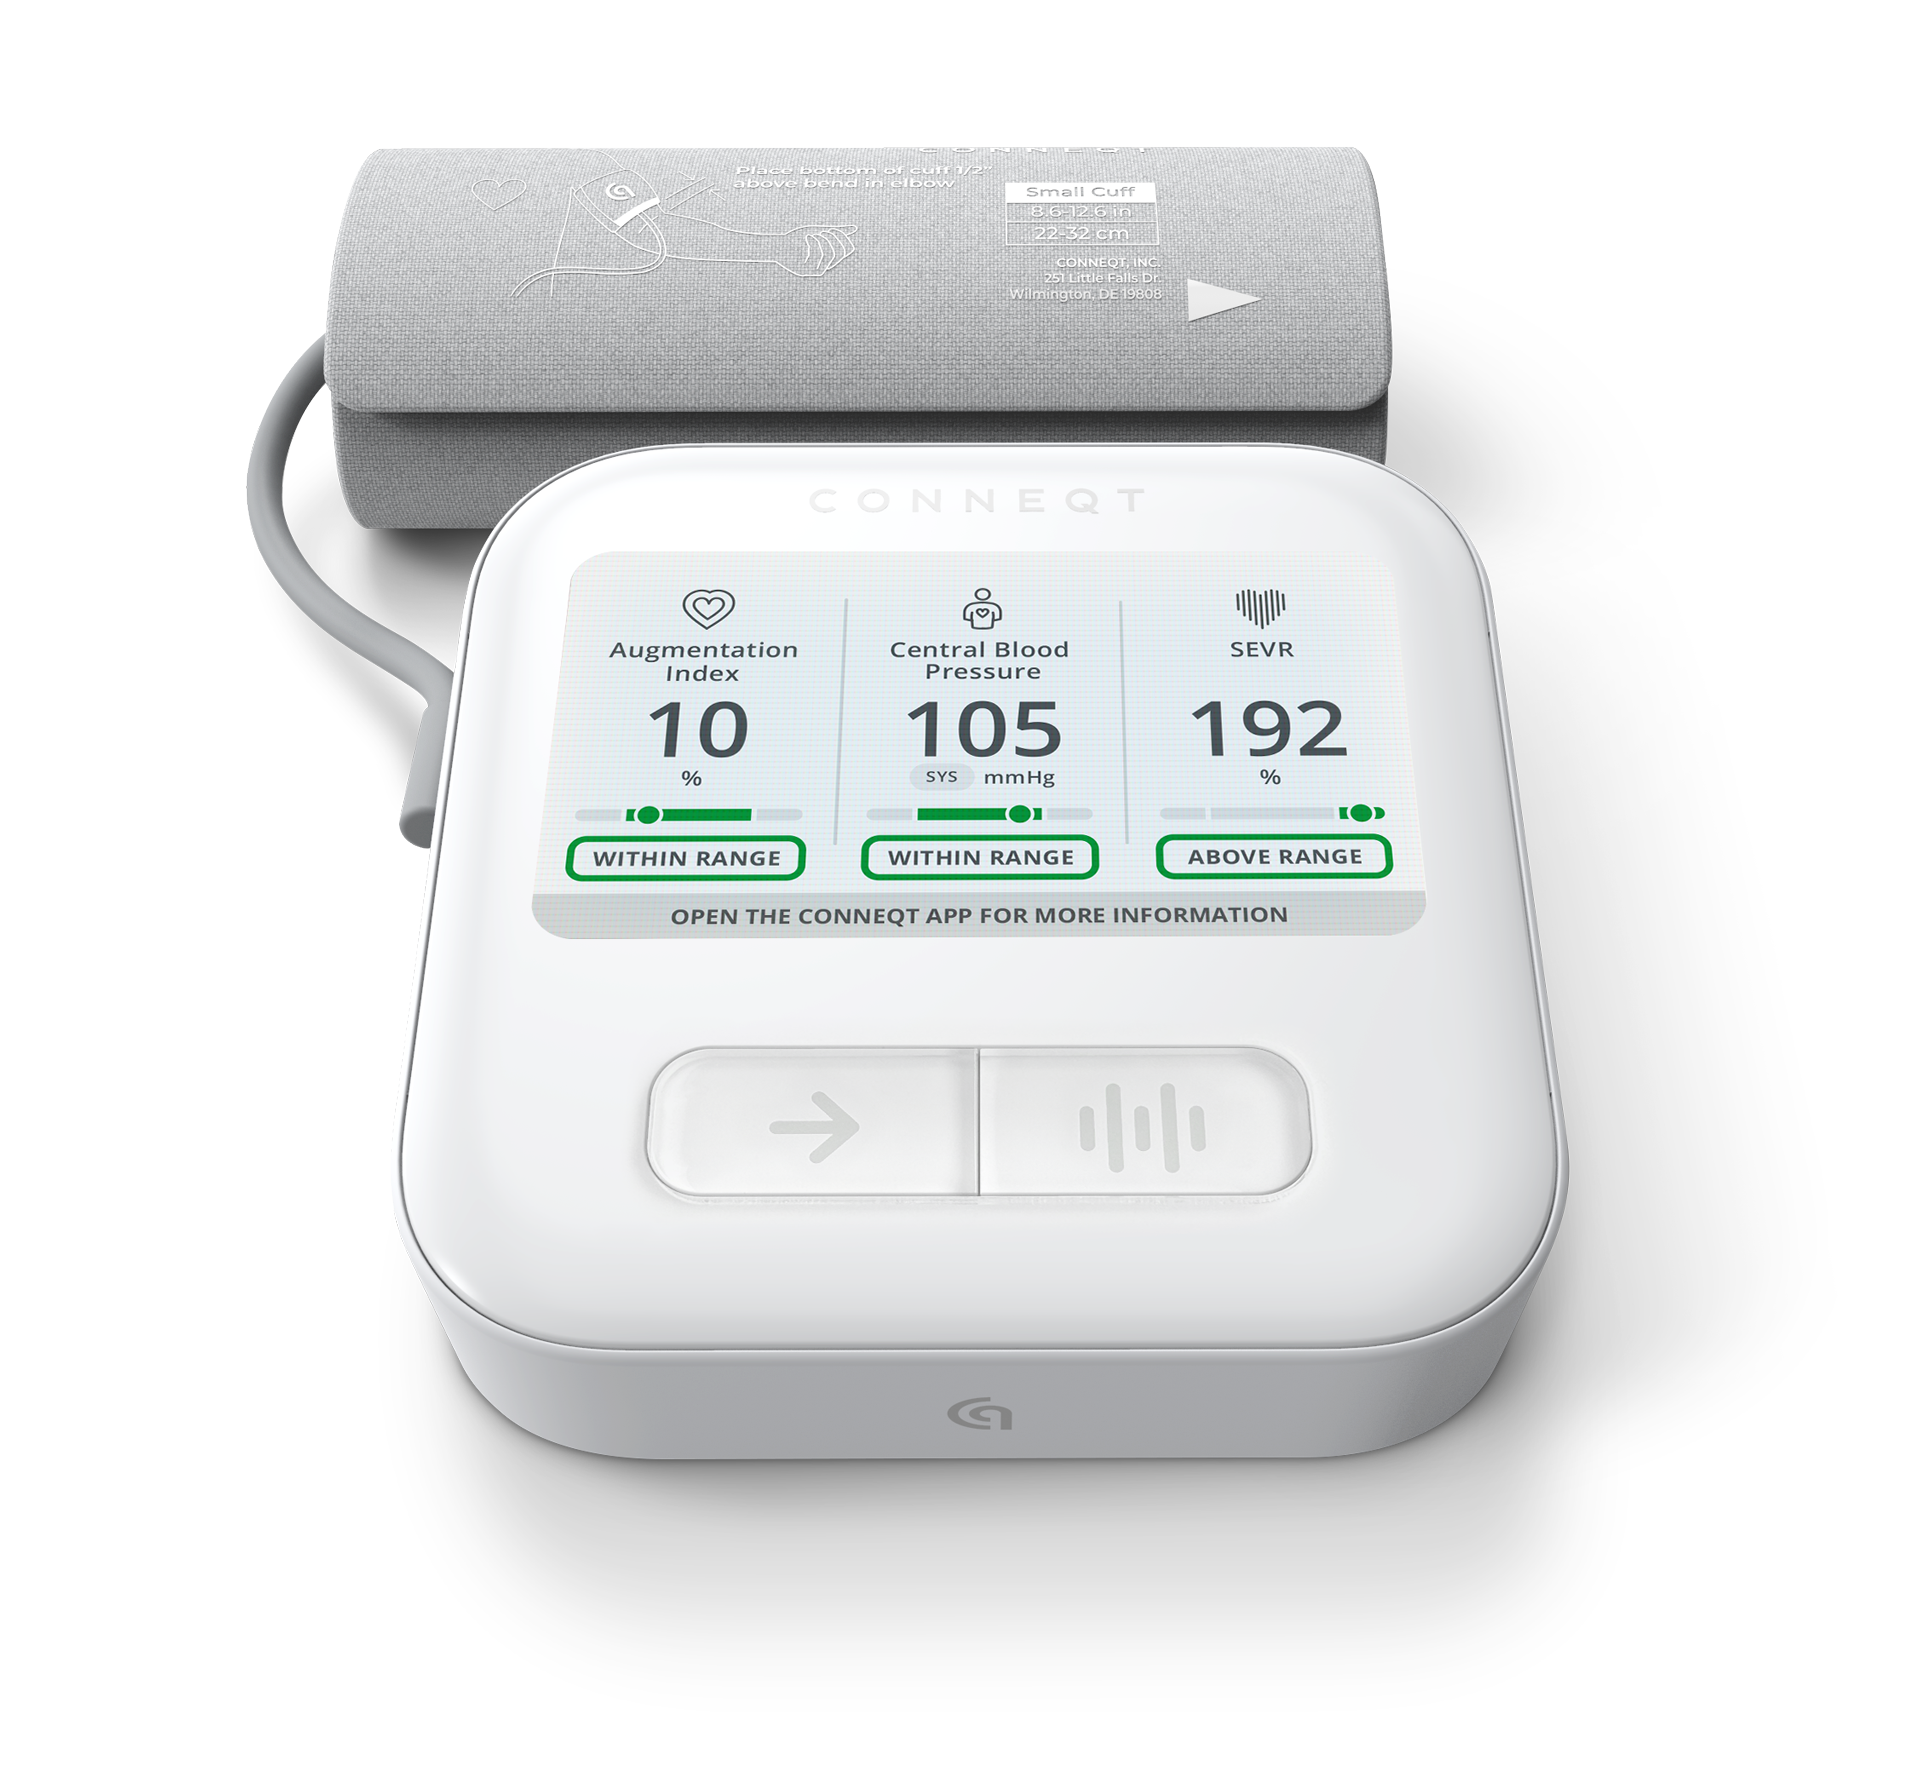
Central blood pressure and arterial stiffness are the signals closer to where those changes originate.
The CONNEQT Pulse tracks both at home. The cuff captures the pressure waveform at your arm. Using pulse wave analysis, it derives what that pressure looks like closer to the heart and the organs it supplies.
The method has been tested against the gold standard of direct aortic measurement and used in clinical settings worldwide for more than two decades.
Not a diagnostic tool. A way to see whether the signals a standard cuff cannot capture are stable, improving, or moving in the wrong direction over time.
A widening pulse pressure. A growing gap between clinic and home. An arterial wall that responds differently than it did a decade ago.
These are the later-in-life arterial signals a brachial reading cannot follow. Consistent tracking of central blood pressure and arterial stiffness is what makes them visible.
What to read next
Blood pressure readings become harder to interpret as you get older, but the signals behind them are not out of reach. The articles below go deeper into the topics this piece introduced.
- Why Arterial Stiffness Doesn’t Wait for High Blood Pressure – Why arterial changes can develop before blood pressure rises, and what that means for how you monitor your cardiovascular health.
- What Your Blood Pressure Reading Misses About Your Heart, Brain, and Kidneys – What your arm cuff cannot capture about the pressure your organs actually experience, and why the gap between the two readings matters.
- Early Signs of Arterial Stiffness: What Changes Before Symptoms Appear – What changes in the arterial wall before symptoms appear, and what earlier visibility into those changes can do for you.
- When Is Blood Pressure Actually High? – How to think about blood pressure readings in context, and what patterns matter more than any single number.
Want to explore more? Browse the full library.


